While studying mathematics you may have noticed that functions are widely used in nearly every subject. In a matter of fact, they are one of the most basic and fundamental objects in mathematics, so in this article, we will learn about functions, their definition, and their properties.
What is a function
We call a function a given relation between elements of two sets, in a way that each element of the first set is associated with one and only one element of the second set. For example, from the set of Natural Number ![]() to the set Natural Numbers
to the set Natural Numbers ![]() , or from the set of Integers
, or from the set of Integers ![]() to the set of Real Numbers
to the set of Real Numbers ![]() .
.
The first set is called the Domain, it is usually denoted by and its elements by
, and the second set is called the codomain noted
and its elements
. A function is usually denoted by a letter like:
,
, or
…etc.
If we take an example of a function called , and
is a relation between the elements
of the set
and elements
of the set
.
is denoted by
and it reads:
of
equal
. The element
here is called the argument or the input of the function
, and we call the element
the value of the function or the image of
by
or the output of
.
For example, we note:
Evaluating a function for a value of
is simply the procedure of replacing
by its given value and calculate the output or the value of
.
Graphical representation
A useful way to see the behavior of the function on its domain of definition is by drawing it graphicly on a plan with two axes on for the values of noted
-axis and one for the
or
noted
-axis. A function
is represented by all the pairs
on a plane generating the Graph of the function
.
The domain of definition
As we said before, the domain of definition is the set of the possible argument (or inputs) of the function, and every element of this set has exactly one image on the codomain. For better understanding let’s see some examples of functions and their domain of definition!
Example: determine the domain of the following functions:
For , we can calculate the value of
for every real number
except for
, because we cannot divide by
i.e.,
, so the domain is all the real numbers except
meaning
we can also note
.
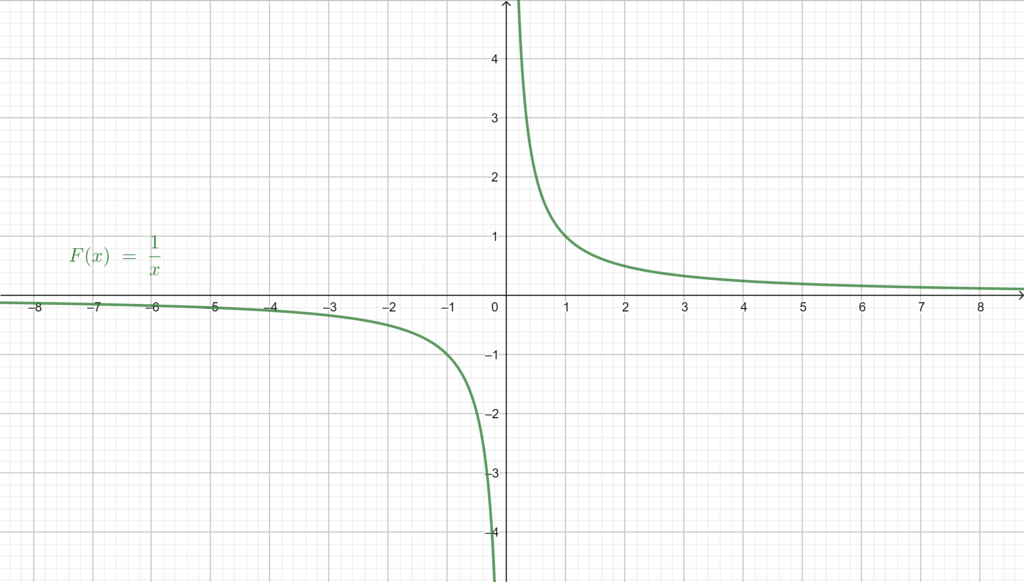
Let’s take a look at the graph of F:
For the case of the second function, to determine the domain of definition of we need to determine and exclude the values of
that make:
- the denominator equal to zero, because we cannot divide by
.
- the square root of
less than zero, because we can’t evaluate the square root of a negative number (In the space of Real Numbers
 ).
).
In other terms, we can evaluate the value of for every real number except for the ones that make the denominator less or equal to
.
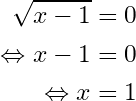
So, for the denominator to be equal to , the expression
has to be equal to
, We have:
So, the value doesn’t belong in the domain of definition
.
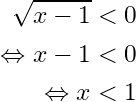
For the square root to be less than zero, we evaluate the expression , we have then:
Therefore, the values don’t belong in the domain of definition
.
So, by combining (the union) the two previous results, we get the excluded values are: .
We conclude that the domain of definition of is
.
(We can also take the opposite direction and instead of looking for the values to exclude we look for the possible values of , meaning the value of
that make
).
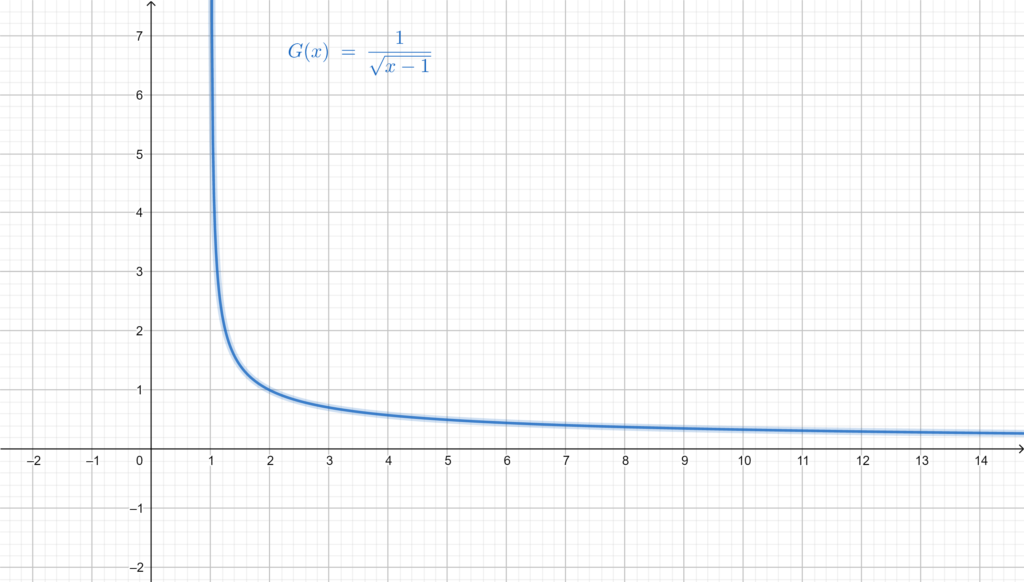
Here is the graphical representation of :
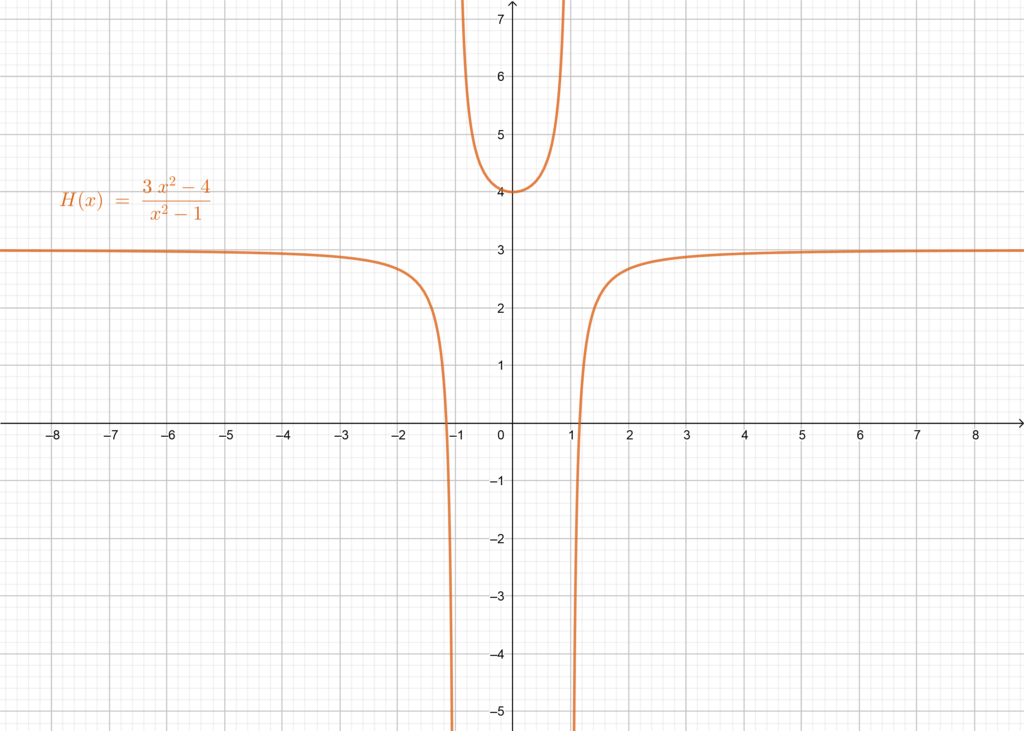
For the third function , we notice that it is in the form of a fraction, so, we need to make sure that the denominator is not equal to zero and exclude the values of
for which it does. In this case, we have the denominator is a polynomial of the second degree, so we need to determine its roots, the denominator
is a remarkable identity (subtraction of two squares), meaning it may be written in the factorial form
. Now to determine the roots of the denominator all we need to do is to solve the equation:
and we have then: or
, these two values of
are excluded from the domain of definition
.
Therefore, the Domain of definition of is:
.
Let’s see the graph of :
The domain of values (or codomain)
Definition: The codomain or the set of destination of a function is the set containing all the output or image of
i.e. the set containing all
for all
in the domain. In other terms, the codomain of a function
is the set of all possible outputs of
.
Note that the codomain can be bigger, smaller, or entirely different from the domain.
For example, A function can have its domain as Natural numbers ![]() , and the codomain as the odd natural numbers; Or it can have its domain as the natural numbers
, and the codomain as the odd natural numbers; Or it can have its domain as the natural numbers ![]() and the codomain as negative integers
and the codomain as negative integers ; Or having the domain as the set of real numbers
![]() and the same for the codomain.
and the same for the codomain.
Let’s take look at an interesting example:
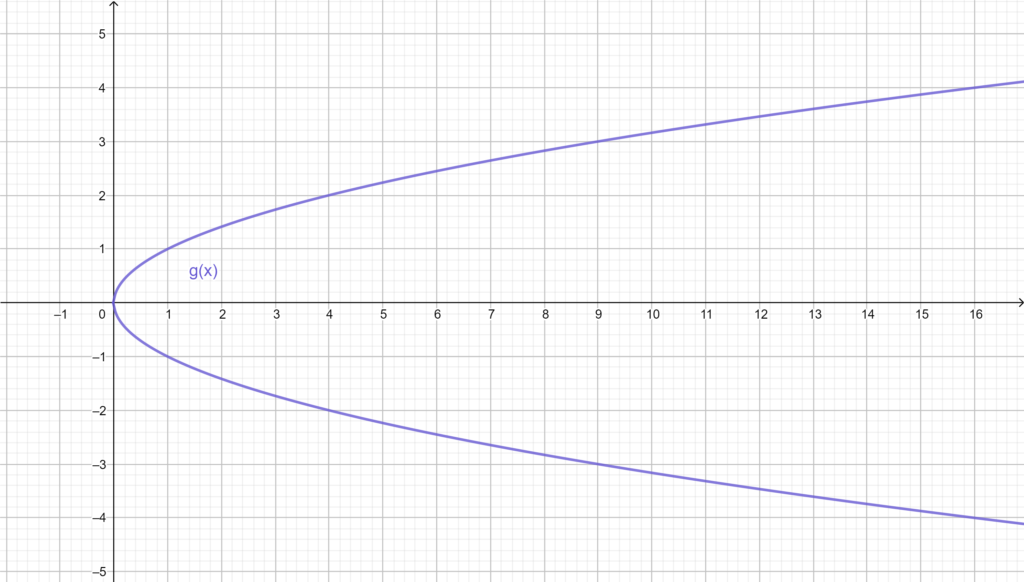
Is the Square root a function? If we take as the square root of a positive real number
, so we have
or
, meaning the
is defined as follows
then is not a function, because as we mentioned at the beginning every element of the domain set must have one and only one image in the codomain, but in this case, each element of the domain has two images one positive and one negative, and therefore
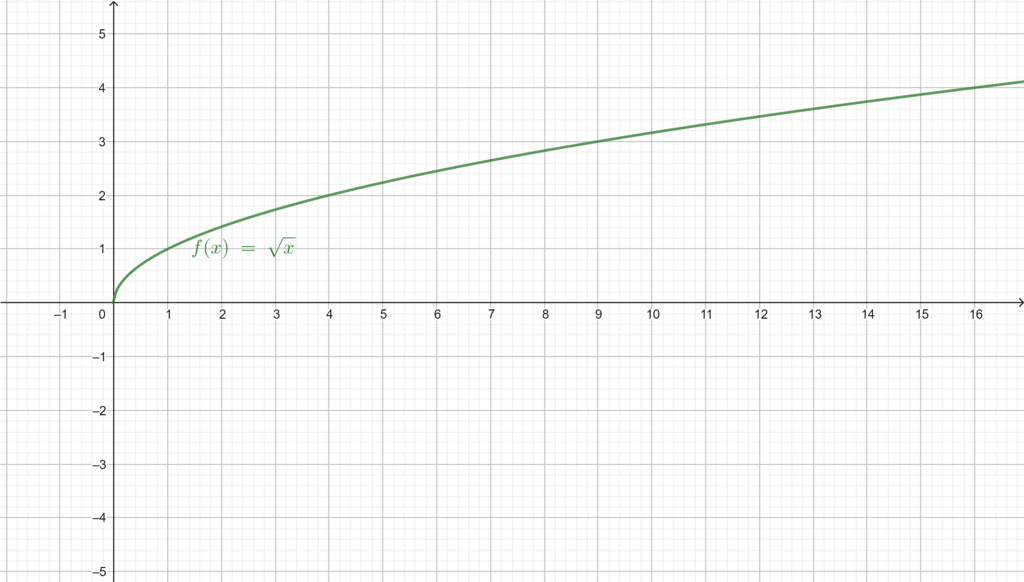
is not a function. This can be fixed by limiting the codomain to only positive real numbers!
Also keep in mind, the Radical sign which we use when calculating the root square of a number always means the positive square root, that’s why
is a function and always givesa positive real numbers as an output.
Here is a graphical representation:
Note that the codomain may contain elements that are not images of any element of the domain, in other terms an element in the codomain doesn’t necessarily mean that there is an element
in the domain that if we take
as input, we will get
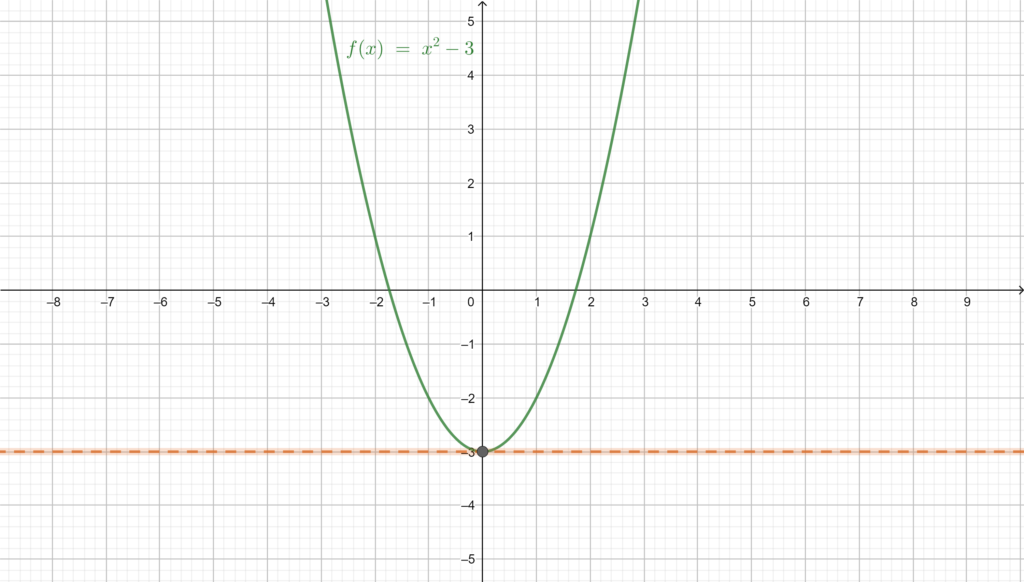
as an output. For better understanding let’s take an example: If we take
as follow:
We have here the domain of is the set of real numbers
![]() , and the codomain is the set of real numbers
, and the codomain is the set of real numbers ![]() . but the image of
. but the image of ![]() by
by (or the inputs) is not all
![]() , it is a sub-set of the codomain
, it is a sub-set of the codomain ![]() . In a matter of fact, The image of
. In a matter of fact, The image of ![]() by
by is
and this is what we call the Range of
, Therefore the image of every element in the domain is contained in the codomain, but not necessarily the opposite.
For more clarification let’s take a look at the graph of and see its range.
Notice that the graph doesn’t go beyond on the
-axis which means the range of
is
and the range is a sub-set of the codomain
![]() since we have:
since we have: .
Even and odd functions
Even function
Definition: a function is called an even function, if and only if it verifies the following property:
Or equivalently
Note that first, the function must have and
as elements of its domain which means the domain must be symmetrical in the first place.
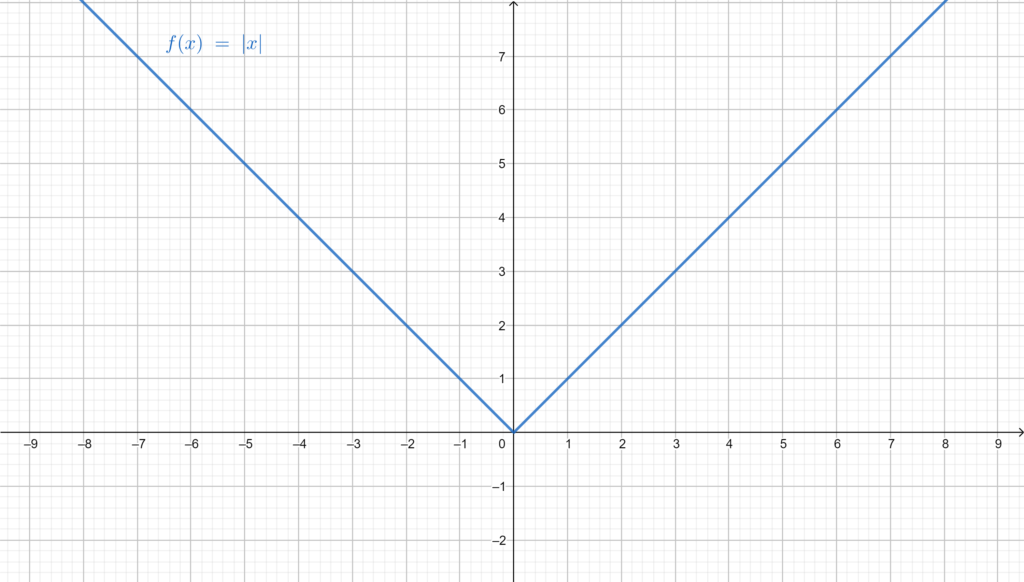
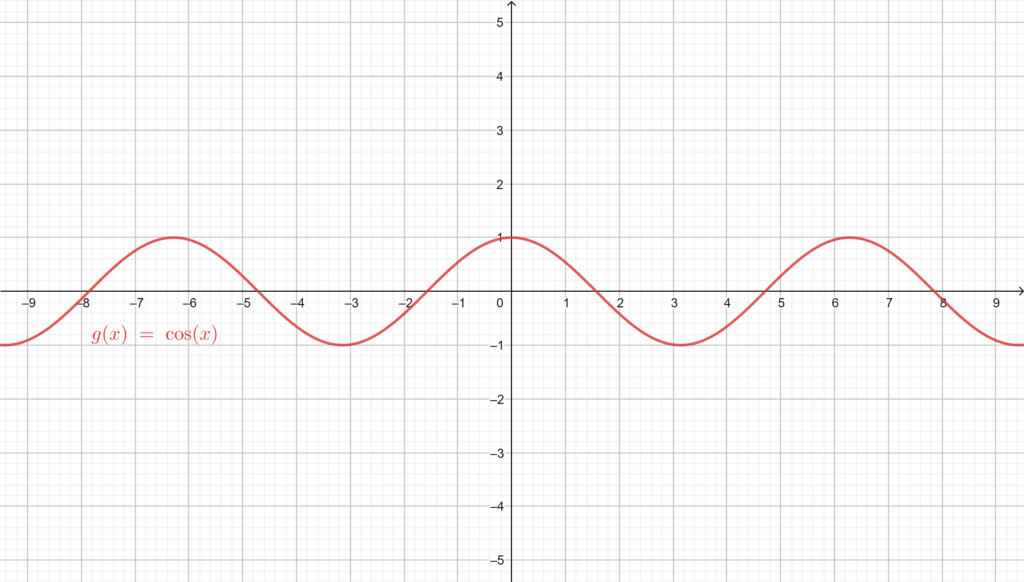
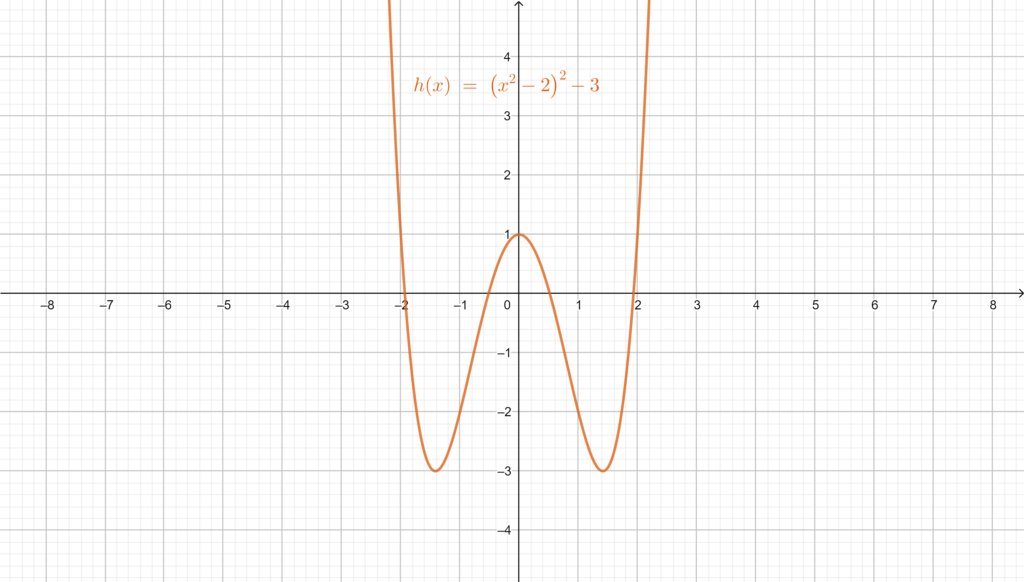
Graphicly speaking, the graph of an even function is symmetrical with respect to the -axis.
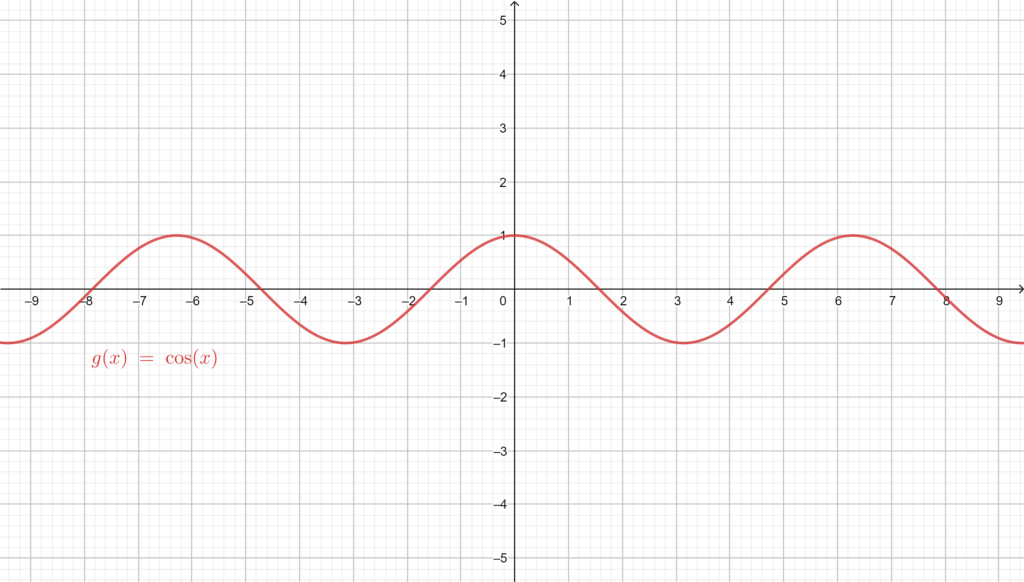
Let’s take a look at some examples of even functions with their respective graphs:
The absolute value:
The cosine:
The function:
Odd function
Definition: a function is an odd function if and only if it verifies the following:
Or equivalently
Note that first, the function must have and
as elements of its domain which means the domain must be symmetrical in the first place.
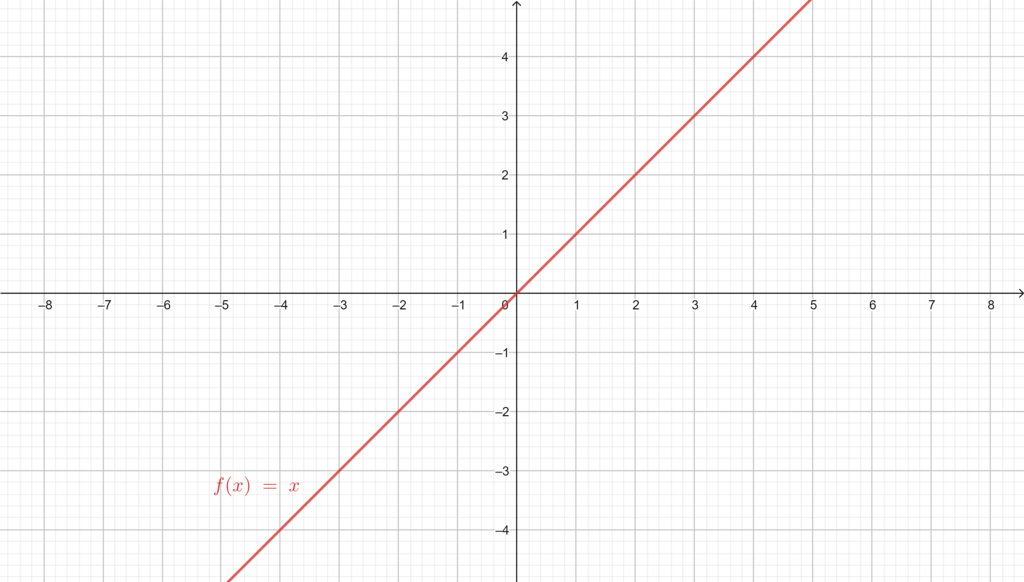
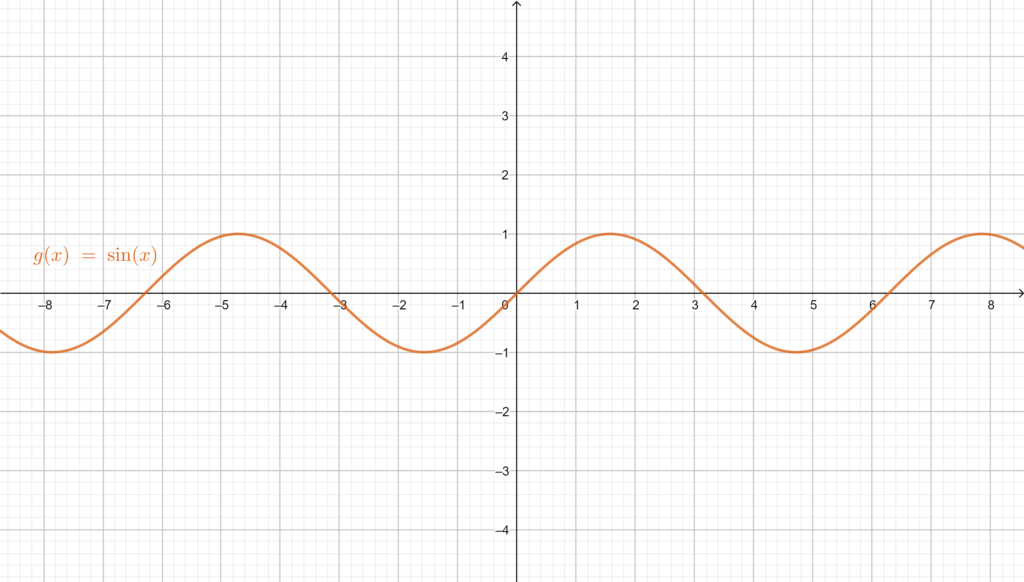
Graphically speaking, the graph of an odd function is symmetrical about the origin .
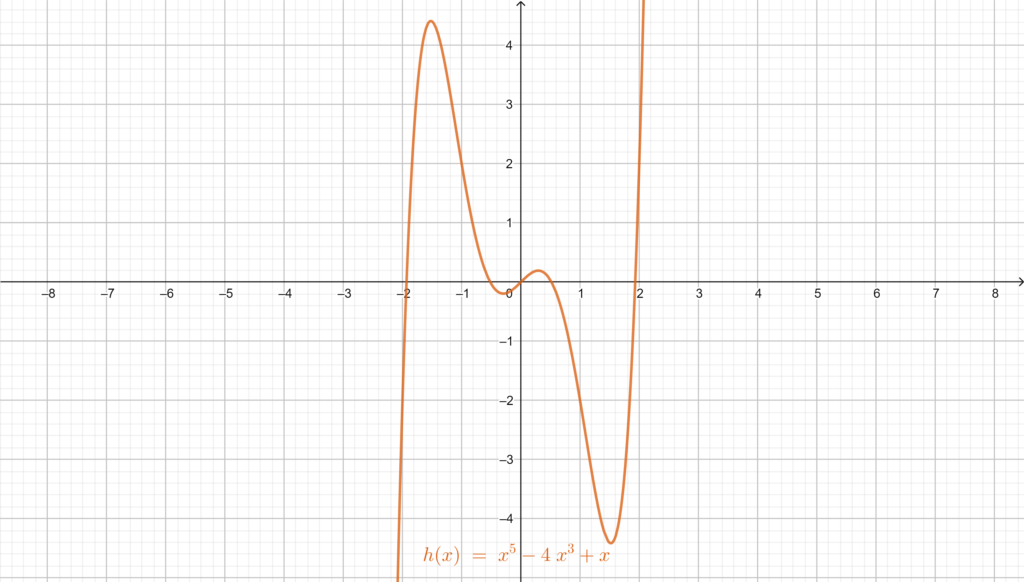
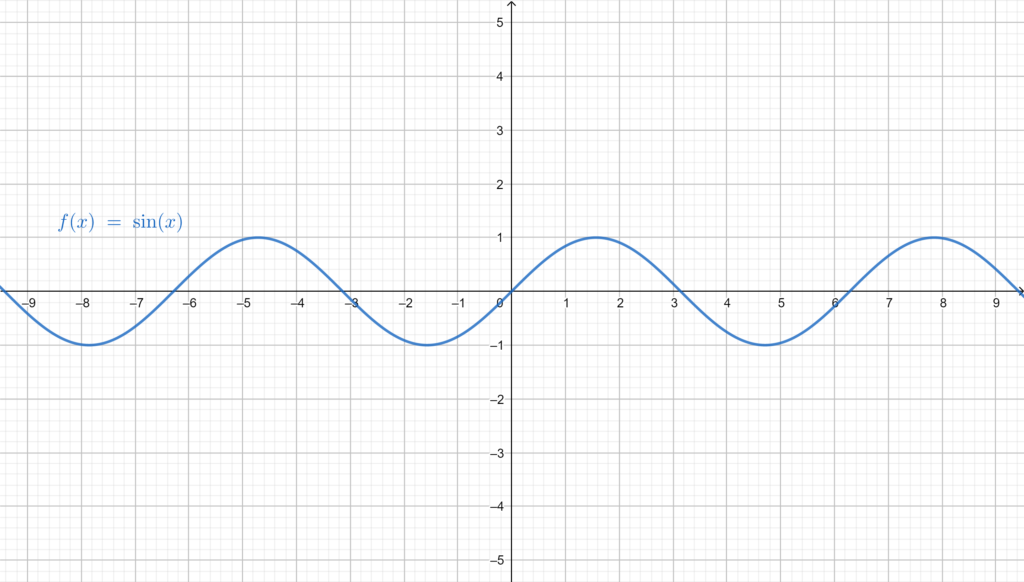
Let’s take a look at some examples of odd functions and their respective graphs:
The identity:
The sine:
The function:
Some properties of Even and odd functions
- The absolute value of an odd function is an even one (the most obvious example, the identity function
is odd and the absolute value of it
is even).
- The summation of two odd functions is an odd one.
- The summation of two even functions is an even one.
- The subtraction of two odd functions is an odd one.
- The subtraction of two even functions is an even one.
- The multiplication of two even functions is an even one.
- The multiplication of two odd functions is an even one.
- The multiplication of an odd function with an even function is an odd one.
- The division of two even functions is an even one.
- The division of two odd functions is an even one.
- The division of an even function and an odd function is an odd one.
You want to try out these properties! Check out the window below and see the results of the summation, subtraction, multiplication, or division of even and odd functions. Check the operation you want to display (one or multiple), and watch the respective graphs. Have fun!!!!!
Periodic functions
We call a periodic function a function that its values (outputs) repeat regularly.
Definition:
A function is called periodic with a period
different than
, if and only if for any
,
, and
of its domain, it verifies the following:
Where is called the period.
Graphicly speaking, a periodic function has a part of its graph repeats regularly.
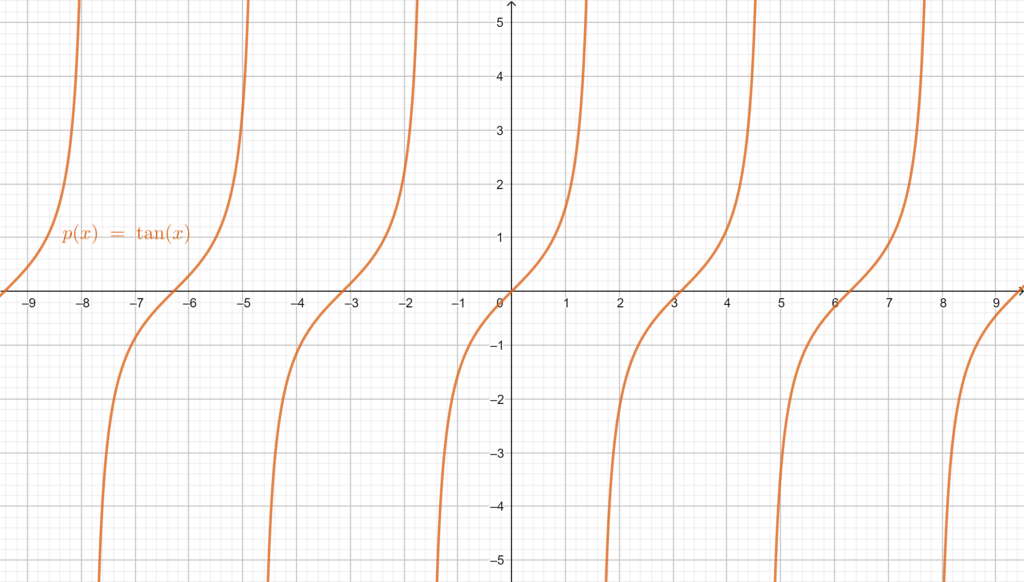
Let’s take a look at some examples of periodic functions and their respective graphs.
The sine:
The cosine:
The tangent:
Some properties of periodicity
- If
is periodic with a period
, then
, where
, is also a period for
.
- To graph a periodic function with a period
, all we need to do is to graph an interval of length
, and then duplicate it at both ends left and right, or in other terms shift the graphed section along the
-axis at a distance
(
) left and right.
- If
is periodic with a period
, then for all
in the domain of definition of
, and for all natural number
we have:
.
- If
is periodic with a period
, then
,
, and
are periodic with period
, where
is a real number diffrent than
.
Conclusion
In this article we learned a little bit about functions and some of their properties and characteristics, this may be considered as an introduction to how to study a function and detect its properties which will help for better understanding of its behavior, but keep in mind this is just an introduction and there is a lot more to learn! isn’t that amazing! So who is eager for another post to learn more about functions!!!!!
Are you looking for another interesting article! Take a look at how to solve polynomial functions of first, second, and third degree. Enjoy!!!


![Rendered by QuickLaTeX.com \[ F(x)=\dfrac{1}{x}; \;\; G(x)=\dfrac{1}{\sqrt{x-1}}; \;\; H(x)=\dfrac{3x^{2}-4}{x^{2}-1}\]](https://www.mathacademytutoring.com/wp-content/ql-cache/quicklatex.com-aa2e45adaf85c3eac99d7189da4926cc_l3.png)
![Rendered by QuickLaTeX.com \[ g(x)=\left\{\begin{array}{lr} \sqrt{x}\\ -\sqrt{x} \end{array}\right. \]](https://www.mathacademytutoring.com/wp-content/ql-cache/quicklatex.com-cfc95f314e7b953107b5142a44162264_l3.png)

